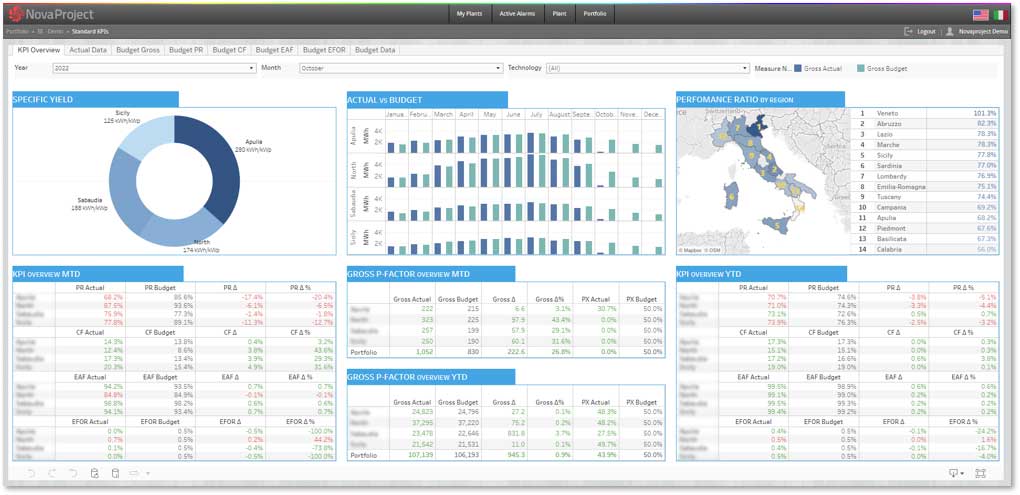
General summary of the main KPIs aggregated by competence cluster. Comparison of Actual vs Budget values on MTD and YTD basis
Performance analysis
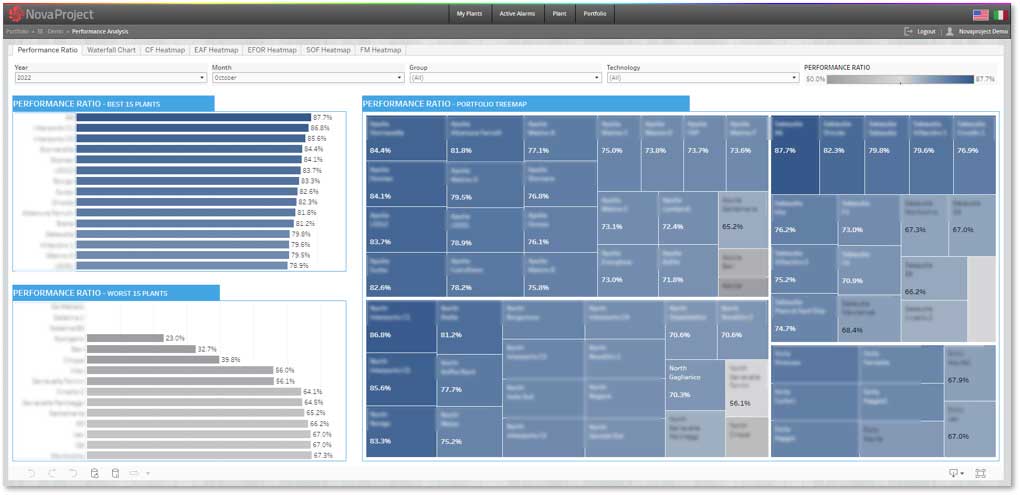
Performance Ratio
Visual detail of the KPI Performance Ratio. The best and worst portfolio plants are highlighted, as well as the performance of individual plants within the groups they belong to
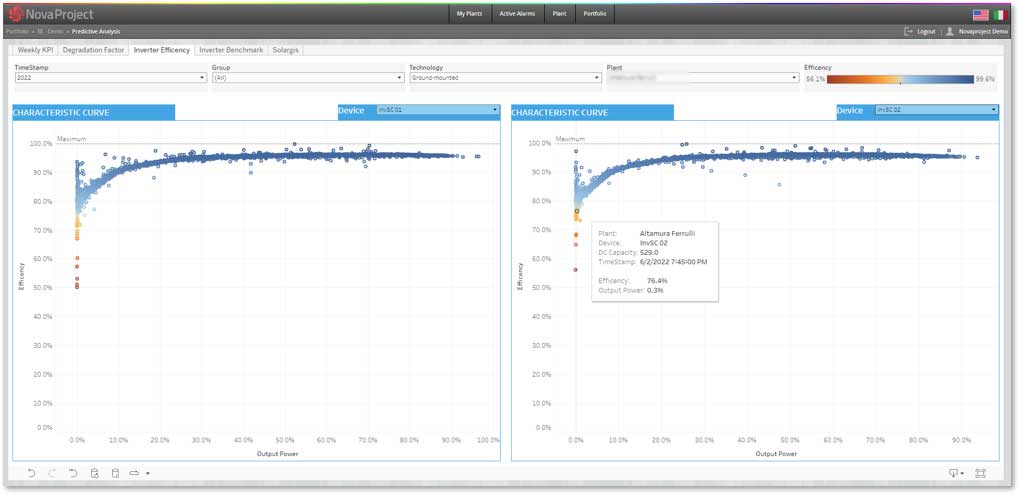
Predictive analysis
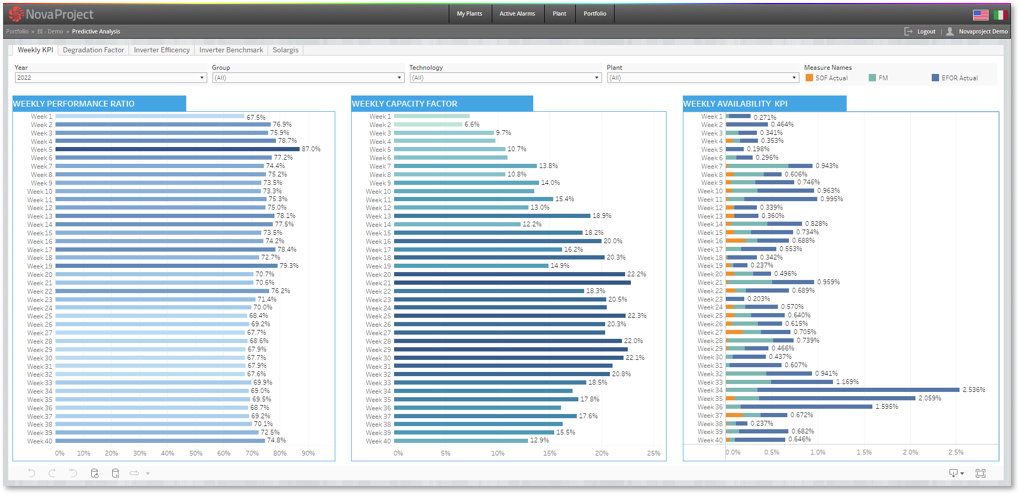
Weekly KPIs
Weekly trend of KPIs Performance ratio, Capacity Factor and Availability (with details on the various components). The data are aggregated at cluster level.
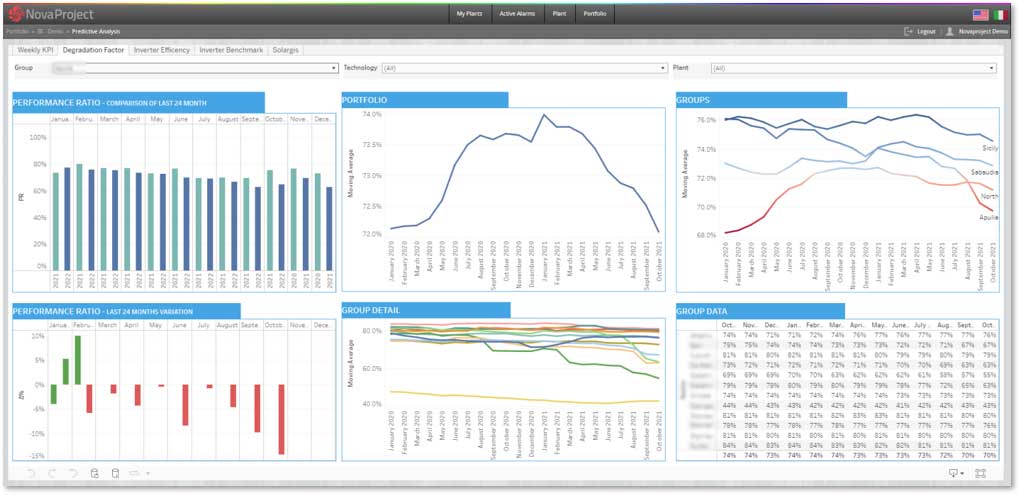
Decay factor
Difference between a moving average value and that of 12 months earlier.